FAIR Data Visualisation - PhD course (2 ECTS)
PhD-level course in Data visualisation with suggested 2 ECTS
2024 Autumn session: December 9-13 & 16, 2024
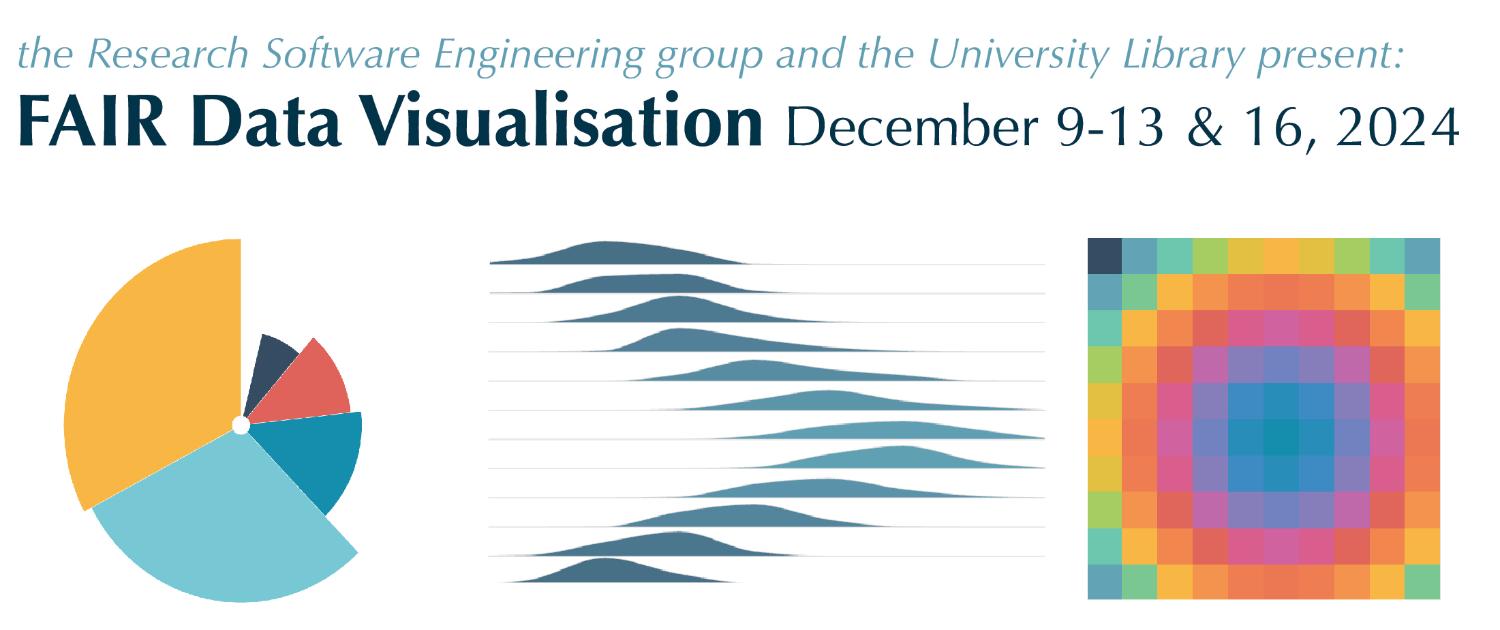
WHAT: Ensuring long term provenance of research data is integral to best practices in research data management, and forms the basis of robust publications. Whether in the form of a thesis, journal article, conference presentation, teaching material or another form of dissemination, scientific publications generally contain visual data representations that present collected data, highlight trends, form conclusions, and suggest future research directions. Data visualisation is a vital part of scientific communication, and good data visualisation requires critical thinking that considers how to most effectively and truthfully present data, as well as show conclusions in meaningful ways that are memorable, effective and responsible.
GOAL: In this course we will take “live data” and use data visualisation skills to build a broad and well-informed toolkit that aids researchers to produce effectual figures for all types of scientific dissemination. By the end of the course, participants will be able to use programming language to construct visualisations (e.g. manuscript figures, slide decks, conference poster), and have increased confidence when presenting their research.
WHO: This course prioritises PhD students who have datasets that need to be visualised and perhaps have limited publication experience, but we also welcome MSc students, postdoctoral fellows, or other early-career researchers.
CONTENT:
Morning lectures: FAIR data, research data management (including data cleaning), principles of data visualisation, charts+attributes and oral presentation skills.
Afternoon sessions: introduction and exploration of visualisation using Python and JupyterLab / Jupyter notebooks.
There will be daily engaging workshops and homework where participants will be expected to actively work on their data.
EVALUATION:
(1) An oral presentation of the finished visualisations on the final day. (
2) A written report. Participants who successfully complete both evaluations will be awarded a certificate with the suggested 2 ECTs that can be applied for at faculty.
Prerequesites:
BYOD: Bring your own data! In order to participate in this course you must have a quantitative dataset that can be worked on during the course. It would also be advisable to have a rough idea of what data will be presented and for what purpose. All participants must bring a computer to work on their own data.
Software: Access to and familiarity with one data processing and visualization software. In this course we will use Excel and Powerpoint, and we will also take first steps in Python/Jupyter notebooks. If you are new to Python, do not worry, we will help setting it up.
RDM webinars: Suggested, not mandatory: Structure and Documenting, Data cleaning UiT Research Data Portal courses
Topics: Principles of Data visualization; FAIR data and Introduction to Research Data Management; Oral Presentation skills; Charts and Attributes; How Python and Jupyter notebooks can help us with Data Visualisation.
Lecturers:
Katie Smart (Academic librarian for physics and computer science at the University library, UiT)
Radovan Bast (Research Software Engineering group, UiT)
Lecture timetable (All sessions in UB 244):
December 9 09:15 – 15:30
December 10 09:15 – 15:30
December 11 09:15 – 15:30
December 12 09:15 – 1530
December 13 09:15 – 12:00
December 16 09:15 – 12:00
DEADLINE FOR REGISTRATION IS December 6 17:00